Understanding Tariff Comparison Table Elements: A Guide to Choosing the Right Web UI Template
In today’s digital age, businesses and consumers alike are constantly comparing products and services online. One of the most effective tools for presenting pricing options clearly and attractively is the tariff comparison table element. Whether you're building a SaaS website, an e-commerce platform, or a subscription-based service, a well-designed tariff comparison table can significantly improve user experience and conversion rates.
What Is a Tariff Comparison Table Element?
A tariff comparison table element is a web UI component that visually organizes different pricing plans—typically labeled as Basic, Standard, and Premium—into a structured layout. This table allows users to easily compare features, benefits, and costs across plans, helping them make informed decisions quickly.
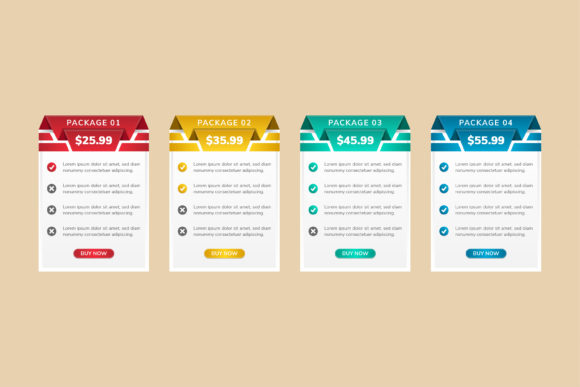
Modern web design often incorporates visually engaging elements such as color-coded pricing tiers, diagonal line patterns, and paper-cut styles to enhance the aesthetics of the table. These design choices not only make the information more digestible but also align with current trends in web development and UI/UX design.
Why Use a Tariff Comparison Table?
The primary purpose of a tariff comparison table is to simplify complex pricing information. Here are some key reasons why this element is crucial in web design:
- Clarity: It organizes multiple pricing options in a single view, reducing confusion.
- Comparison: Users can evaluate features and benefits side-by-side, leading to faster decision-making.
- Conversion Optimization: Clear and visually appealing tables encourage users to choose a plan and proceed with a purchase.
- Brand Credibility: A well-structured table reflects professionalism and transparency, building trust with potential customers.
Components of a Tariff Comparison Table
A typical tariff comparison table consists of four columns: one for plan names and three for the actual plans (Basic, Standard, and Premium). Each row represents a specific feature or service, and the columns indicate whether the feature is available in each plan.
Here’s a breakdown of the essential components:
- Plan Names: Usually labeled as Basic, Standard, and Premium, these represent different tiers of service or pricing.
- Features: These are the functionalities or services included in each plan (e.g., storage, support, customization).
- Availability Indicators: Checkmarks, Xs, or brief descriptions show whether a feature is included in a specific plan.
- Pricing: The cost associated with each plan, often displayed at the bottom of each column.
Designing a Visually Engaging Tariff Table
While functionality is key, the visual design of your tariff comparison table plays a major role in user engagement. Here are some popular design trends that enhance the user experience:
- Color-Coded Options: Using different colors for each pricing tier helps users quickly identify the plan they're interested in. For example, green for Basic, blue for Standard, and gold for Premium.
- Diagonal Line Patterns: These add a dynamic and modern touch to the layout, breaking up the monotony of straight lines and boxes.
- Paper Cut Style: This design mimics a hand-cut paper effect, giving the table a more organic and creative feel, ideal for brands that want to appear approachable and innovative.
- Infographic Design: Incorporating icons, charts, and minimal text can make the comparison more engaging and easier to digest.
How to Choose the Right Tariff Table Template
When selecting a web UI template for your tariff comparison table, consider the following factors:
- Responsiveness: Ensure the table is mobile-friendly and adjusts well to different screen sizes.
- Customizability: Choose a template that allows you to modify colors, fonts, and layout to match your brand identity.
- Accessibility: Use clear fonts, sufficient contrast, and alt text for images to ensure all users can navigate the table easily.
- Integration: Make sure the template works seamlessly with your content management system (CMS) or website builder.
Practical Applications in Business and Everyday Use
Tariff comparison tables are widely used across various industries and platforms. Here are a few examples of how they are applied in real-world scenarios:
- Software as a Service (SaaS): Companies like Slack, Zoom, and Adobe use tariff tables to showcase their different subscription plans and features.
- E-commerce: Online marketplaces often use comparison tables to help customers choose between different shipping options, membership tiers, or product bundles.
- Education Platforms: Online learning platforms like Coursera and Udemy use these tables to compare course access, certification options, and support features.
- Telecom and Utilities: Internet service providers and mobile carriers use tariff tables to display data plans, contract terms, and additional services.
Common Misconceptions About Tariff Tables
Despite their usefulness, there are a few misconceptions about tariff comparison tables that are worth clarifying:
- More Features = Better Plan: While Premium plans often include more features, they may not be necessary for every user. It’s important to highlight which features are essential for different customer segments.
- All Plans Should Be Visible: Sometimes, hiding the most expensive or least popular plan can help guide users toward the most suitable option based on their needs.
- Color Doesn’t Matter: Color psychology plays a significant role in decision-making. For example, red might signal urgency or warning, while green is often associated with success or approval.
Best Practices for Creating an Effective Tariff Comparison Table
To ensure your tariff comparison table serves its purpose effectively, follow these best practices:
- Keep It Simple: Avoid overcrowding the table with too many features. Focus on what matters most to your users.
- Highlight the Recommended Plan: Use visual cues like badges or bold borders to draw attention to the most popular or recommended option.
- Use Real Examples: Instead of vague terms like “Advanced Support,” use specific descriptions like “24/7 live chat support” to add clarity.
- Include a Call-to-Action (CTA): Each plan should have a clear CTA button like “Get Started” or “Upgrade Now” to encourage conversions.
- Test and Iterate: Use A/B testing to determine which layout, color scheme, or feature list performs best with your audience.
Conclusion: The Power of a Well-Designed Tariff Table
In conclusion, a well-crafted tariff comparison table element is more than just a design tool—it’s a strategic asset that enhances user experience, boosts conversions, and builds trust with your audience. Whether you're launching a new product, redesigning your website, or optimizing your sales funnel, investing in a high-quality web UI template with a visually appealing tariff table is a decision that pays dividends.
By leveraging modern design trends like color-coded options, diagonal line patterns, and infographic styles, you can create a comparison table that not only informs but also engages and converts. Remember, the goal is to make it as easy as possible for users to understand their options and make a confident choice—and a thoughtfully designed tariff table is one of the best ways to achieve that.